
Asean
Increase in coal tax will scale up Indian renewables
Author: Pallav Purohit, IIASA
India needs economic growth for sustainable development, which in turn requires access to clean, convenient and reliable energy. An estimated 400 million people still lack access to electricity, and blackouts are still common across the country. A combination of rapidly increasing energy demand and fuel imports plus growing concern about economic and environmental consequences is generating growing calls for innovative policies and mechanisms to promote increased use of abundant, sustainable, renewable resources.
.")
The Indian government initiated a renewable energy program to diversify national energy sources about three decades ago. The government aimed to add 455 GW of renewable capacity by 2050. Currently, renewable sources contribute about 13 per cent (32 GW) to India’s 249 GW installed capacity base.
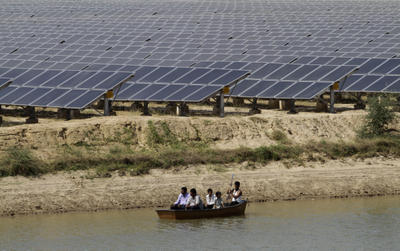
The National Action Plan for Climate Change (NAPCC) sets a target for the share of renewables-based power generation from the current 4 per cent to 15 per cent by 2020. As a result, renewable projects currently benefit from several policy initiatives: accelerated depreciation benefits, feed-in tariffs, a ten-year tax holiday and generation-based incentives. As part of the NAPCC, the government launched the Jawaharlal Nehru National Solar Mission (JNNSM) in 2010 which aims to add 20 GW of grid-connected solar capacity by 2022, along with other solar targets for off-grid space.
The government plans to launch a similar program for wind. The National Wind Energy Mission, announced in January, will aim for 100 GW of wind power by 2022, a third of India‘s estimated wind energy potential. While the government has taken certain measures for the promotion of renewables, these need to be scaled up and expedited. The development of the sector suffers from a number of constraints, overlaps and gaps in the current policy and regulatory environment.
The government’s ambitious goals for solar energy, coupled with the country’s rapid progress in developing wind energy, raise many questions regarding the sources and costs of the investment that will be needed to install and operate this infrastructure. Stressing the need for India to start addressing its emissions, a government report released at the end of May 2014 put the costs of investing in low carbon energy systems at US$834 billion up to 2030.
The National Clean Energy Fund (NCEF), announced by the Indian government in its Union Budget 2010-11, is seen as a major step in India’s quest for energy security and reducing the carbon intensity of energy. The objectives of the NCEF are to fund research and innovative projects in clean energy technologies and to harness renewable sources to reduce dependence on fossil fuels.
The former UPA government had decided to levy a tax of $US0.84 per tonne on both domestically produced and imported coal to build up the NCEF, and fund research and innovative projects in clean energy technology. However, the NCEF has been widely criticised for inconsistencies between the stated objectives, operational guidelines and final approval of the projects. The government had collected over US$6.5 billion through the tax. But it has allocated just over 1 per cent of this amount to the Ministry of New and Renewable Energy (MNRE), out of which just US$267,000 has been spent so far on renewable energy projects in the past three years. There was a high degree of policy and regulatory uncertainty for investment in the renewables sector.
The newly elected Modi government announced a suite of initiatives for solar energy across the country and promised a ‘saffron revolution’ that will include ambitious targets for small, large and off-grid solar and a switch away from an assumed reliance on coal as the country seeks to deliver on its momentous task of bringing electricity to the entire country. The new government increased the coal tax to US$1.67 per tonne in July 2014. While this proposal was welcomed by renewable energy experts, there is uncertainty over what the additional revenue will be spent on, based on past experience.
The scope of expenditure from this fund has also been widened to include environmental projects and research and development projects in the clean energy and environment sectors. The new government will fund its ambitious Ganga rejuvenation plan with the tax on coal. It is also planning to spend as much as US$167 million on projects earmarked for this financial year and has earmarked US$84 million for the initial implementation work for four ultra-mega solar power projects each with a capacity between 2 GW and 4 GW — the energy situation could change rapidly.
Another US$67 million would be provided for installation of 100,000 solar-powered irrigation sets and water-pumping stations. Moreover, the canal-top solar power plant will receive US$17 million this year. The new government also plans for a 5 GW solar power project in the Ladakh region. This further emphasises the scale of India’s renewable ambitions. The recently-announced Wind Energy Mission has also pinned its hopes on the NCEF for potential funding.
The increase in the clean energy tax can be still considered an innovative attempt by the Modi government to acquire additional resources to support its environmental plans. It can be seen as a step towards helping India meets its voluntary target to reduce the amount of carbon dioxide released per unit of gross domestic product by 25 per cent from 2005 levels by 2020. The NCEF must be used to provide much-needed impetus for the development of emerging renewable and clean energy technologies, and the financial capital to early-stage and high-potential projects. It is important that the government provides easier access to finance through NCEF for the renewables sector.
Pallav Purohit is Research Scholar at the International Institute for Applied Systems Analysis (IIASA).
More here:
Increase in coal tax will scale up Indian renewables


Asean
ASEAN weathering the COVID-19 typhoon
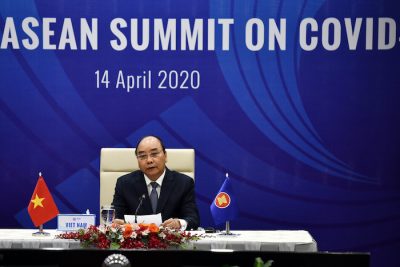
Author: Sandra Seno-Alday, Sydney University
The roughly 20 typhoons that hit Southeast Asia each year pale in comparison to the impact on the region of COVID-19 — a storm of a very different sort striking not just Southeast Asia but the world.
Just how badly is the COVID-19 typhoon thrashing the region? And what might the post-crisis recovery and reconstruction look like? To answer these questions, it is necessary to investigate the strengths and vulnerabilities of Southeast Asia’s pre-COVID-19 economic infrastructure.
Understanding the structure of the region’s economic house requires going back to 1967, when Southeast Asian countries decided to pledge friendship to one another under the ASEAN framework. While other integrated regions such as NAFTA and the European Union have aggressively broken down trade barriers and significantly boosted intra-regional trade, ASEAN regional economic integration has chugged along slower.
Southeast Asian countries have not viewed trade between each other as a top priority. The trade agreements in the region have been forged around suggestions for ASEAN countries to lower tariffs on intra-regional trade to within a certain range and across limited industries. This has lowered but not eliminated barriers to intra-regional trade. Consequently, a relatively significant share of Southeast Asian trade is with countries outside the region. This active extra-regional engagement has resulted in ASEAN countries’ successful integration into global value chain networks.
A historically outward-facing region, in 2010 around 75 per cent of Southeast Asian commodity imports and exports came from countries outside of ASEAN. This share of extra-regional trade nudged closer to 80 per cent in 2018. This indicates that ASEAN’s global value chain network embeddedness has deepened over time.
Around 40 per cent of ASEAN’s extra-regional trade is with the rest of Asia. From 2010 to 2018 Southeast Asian countries forged major trade relationships with four Asian countries: China, Japan, South Korea and India. Outside Asia, the United States is the region’s major trading partner. ASEAN’s trade focus on Asia’s largest markets is not surprising. Countries tend to establish trade relationships with large, geographically close, and culturally similar markets.
Fostering deep relationships with a few large markets, however, is a double-edged sword. While it has allowed ASEAN to benefit from integration in global value chains, it has also resulted in increased vulnerability to the shocks affecting its network connections.
ASEAN’s participation in global value chains has allowed it to transition from a net regional importer in 1990 to a net regional exporter in 2018. But the region’s deep embeddedness in a small and tightly-coupled network cluster of extra-regional global value chain partners has exposed it to disruption to any and all of its external partners. By contrast, ASEAN’s intra-regional trade network structure is much more loosely-coupled: a consequence of persistent intra-regional trade barriers and thus lower intra-regional trade intensity.
In the pre-COVID-19 period, ASEAN built for itself an economic house held up by just five extra-regional markets, while doing less to expand and diversify its intra-regional trade network. The data shows that ASEAN trade became increasingly concentrated in these few external markets between 2010 and 2018.
This dependence on a handful of markets does not bode well for risk and crisis management. All of the region’s major trading partners have been significantly affected by COVID-19 and this in turn is blowing the ASEAN economic house down.
What are the ways forward? The immediate task at hand is to get a better picture of the region’s position in global value chain networks and to get on top of managing its network risk exposure. Already there are red flags around the region’s food security arising from its position in food value chains. It is critical to look for ways to introduce flexibility into existing supply chains for greater agility in responding to crises.
It is also an opportune time for ASEAN to harness the technology transfer gains of global value chain participation and invest in innovation-driven diversification of products and markets. The region’s embeddedness in global value chain networks certainly places it in a strong position to readily access large export markets not just in Asia but also Europe and the Americas.
Over the longer term, ASEAN is faced with the question of whether it should seriously look…
Markets
Tiger Trade Launches SGX Trading, Meeting Demand from Asian Investors
Access to the Singapore Exchange (SGX) adds to Tiger Brokers’ current menu of stock exchanges, such as the New York Stock Exchange (NYSE) and the Nasdaq Stock Market (NASDAQ), the world’s two largest stock exchanges, as well as the Hong Kong Stock Exchange (HKEX).

SINGAPORE (ACN Newswire) – Tiger Trade, a one-stop mobile and online trading application by Tiger Brokers, has launched access to the Singapore Exchange (SGX).
(more…)Asean
Can Asia maintain growth with an ever ageing population ?
To boost productivity in the future, Asian governments will have to implement well-targeted structural reforms today.
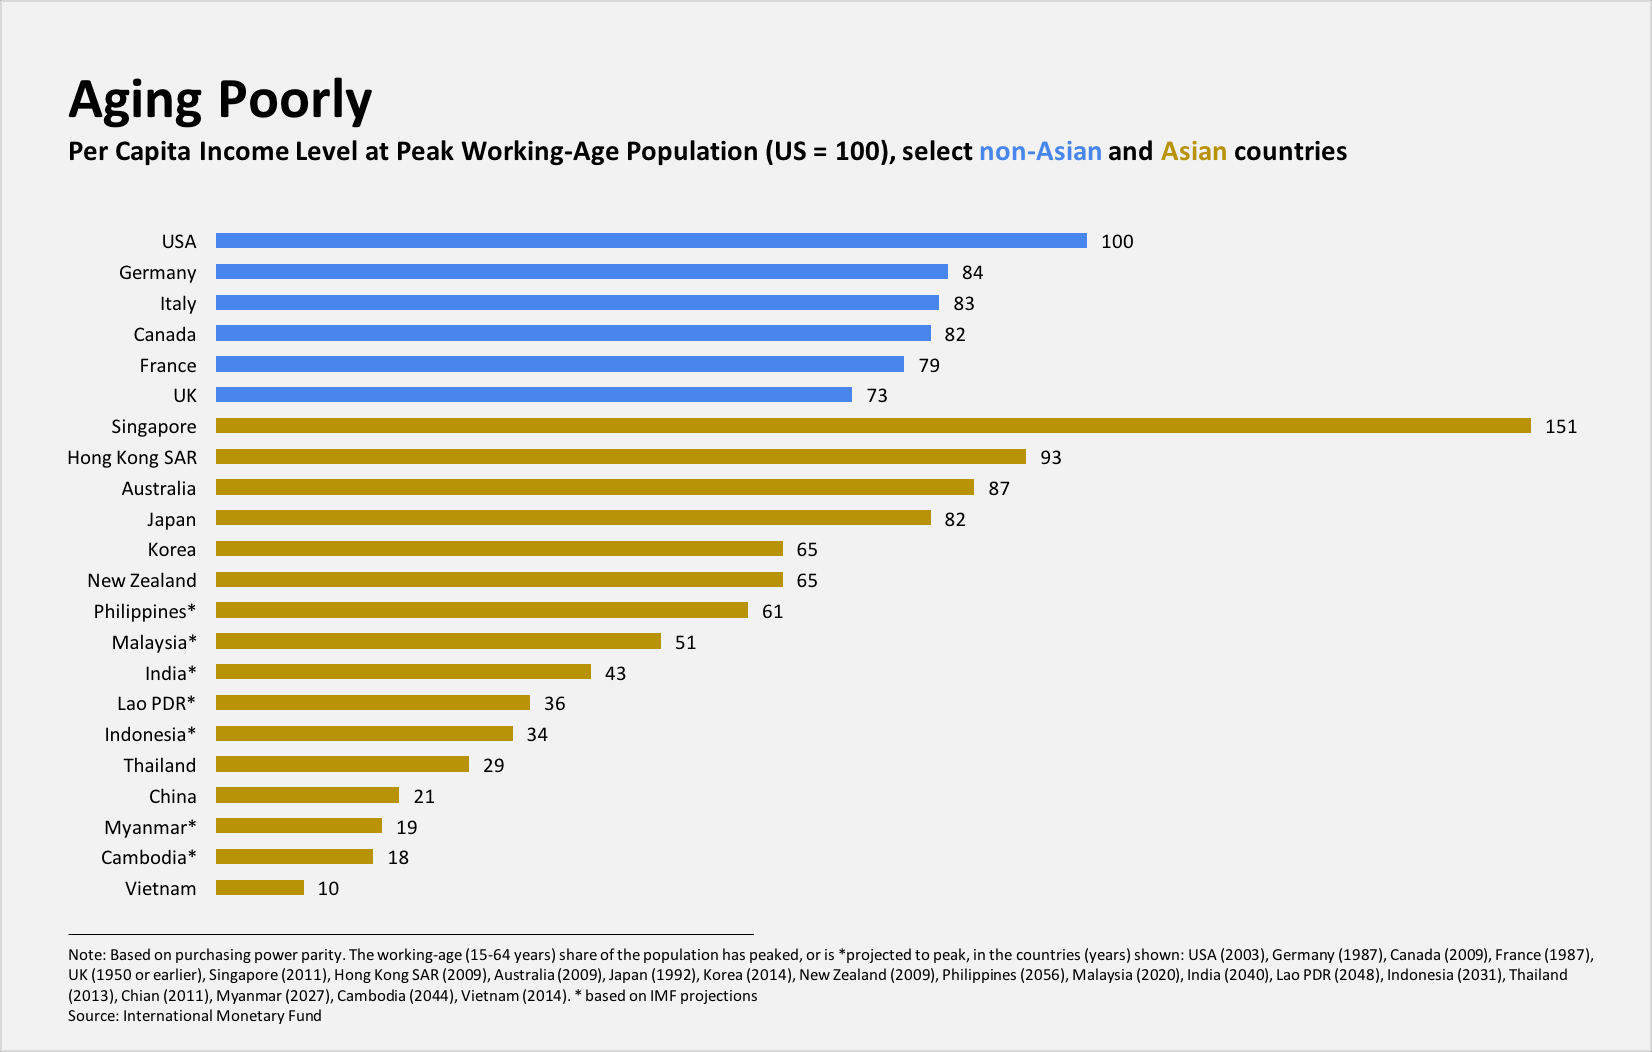
Asia has been the world champion of economic growth for decades, and this year will be no exception. According to the latest International Monetary Fund Regional Economic Outlook(REO), the Asia-Pacific region’s GDP is projected to increase by 5.5% in 2017 and 5.4% in 2018. (more…)
- New Report from Dezan Shira & Associates: China Takes the Lead in Emerging Asia Manufacturing Index 2024

- Is journalist Vicky Xu preparing to return to China?
- Guide for Foreign Residents: Obtaining a Certificate of No Criminal Record in China

- China Unveils Plan to Upgrade Industrial Equipment

- China deepens engagement with new Indonesian president as top diplomat visits Jakarta

- New Publication: A Guide for Foreign Investors on Navigating China’s New Company Law